Ries data
Ries et. al. data contains data of a experimental campaign on 21 experimental sites with 6 distinct experiments on each site. The data is published in an institutional repository, without table descriptive metadata interpreted by this repository. Metadata for each table column is contained within the data *.tsv files in comment rows, which were extracted and parsed to fricitonless descriptors. Concepts from controlled vacabularies were assigned to the fricitonless descriptor from a user defined mapping.
[1]:
from dataset_loader import *
import matplotlib.pyplot as plt
[5]:
import os
os.listdir()
[5]:
['.ipynb_checkpoints',
 'agrov.dump',
 'application_examples.md',
 'concept_unit_method.md',
 'dataset_loader.py',
 'example_datasets',
 'requirement_template.ipynb',
 'reuse',
 'runoff.ipynb',
 'runoff_TUBAF.ipynb',
 '__pycache__']
[6]:
RIES = load_sp_datapackage({"sourcedir": "example_datasets/RIES/"}, 'RIES')
#sorted(get_dataset_concepts(TUBAF, vocab = optio))
RIES
[6]:
{'resources': [{'name': '1_site_data',
'type': 'table',
'path': 'tables/1_site_data.csv',
'scheme': 'file',
'format': 'csv',
'mediatype': 'text/csv',
'encoding': 'utf-8',
'schema': {'fields': [{'name': 'Site_number',
'type': 'integer',
'description': ' ID number of '
'experiment location ',
'unit': '-',
'concept': ''},
{'name': 'Site_name',
'type': 'string',
'description': ' Name of experiment '
'location ',
'unit': '-',
'concept': 'http://aims.fao.org/aos/agrovoc/c_330988'},
{'name': 'Elevation',
'type': 'integer',
'description': ' Elevation ',
'unit': 'mabovesealevel',
'concept': 'http://aims.fao.org/aos/agrovoc/c_316'},
{'name': 'Slope',
'type': 'integer',
'description': ' Average slope at the '
'experimental plot ',
'unit': '%',
'concept': 'http://aims.fao.org/aos/agrovoc/c_fa256eab'},
{'name': 'Slope_aspect',
'type': 'integer',
'description': ' Slope aspect of the '
'experimental plot ',
'unit': '°',
'concept': 'http://aims.fao.org/aos/agrovoc/c_1832474d'},
{'name': 'Land_use',
'type': 'string',
'description': ' Land use at the '
'experimental plot ',
'unit': 'pasturearableland',
'concept': ''},
{'name': 'Vegetation',
'type': 'string',
'description': ' Type of vegetation on '
'the experimental plot ',
'unit': '-',
'concept': 'https://agrovoc.fao.org/browse/agrovoc/en/page/c_8176'},
{'name': 'Vegetation_height',
'type': 'number',
'concept': 'https://agrovoc.fao.org/browse/agrovoc/en/page/c_61f3cae5'},
{'name': 'Plant_coverage',
'type': 'number',
'description': ' Estimated percentage '
'of plant coverage ',
'unit': '%',
'concept': ''},
{'name': 'Geology_GUEK300',
'type': 'string',
'concept': ''},
{'name': 'Sand_10cm',
'type': 'number',
'description': ' Fraction of sand in 10 '
'cm depth ',
'unit': '%',
'concept': ''},
{'name': 'Silt_10cm',
'type': 'number',
'description': ' Fraction of silt in 30 '
'cm depth ',
'unit': '%',
'concept': ''},
{'name': 'Clay_10cm',
'type': 'number',
'description': ' Fraction of clay in 50 '
'cm depth ',
'unit': '%',
'concept': 'http://aims.fao.org/aos/agrovoc/c_15619'},
{'name': 'Sand_30cm',
'type': 'number',
'description': ' Fraction of sand in 10 '
'cm depth ',
'unit': '%',
'concept': ''},
{'name': 'Silt_30cm',
'type': 'number',
'description': ' Fraction of silt in 30 '
'cm depth ',
'unit': '%',
'concept': ''},
{'name': 'Clay_30cm',
'type': 'number',
'description': ' Fraction of clay in 50 '
'cm depth ',
'unit': '%',
'concept': 'http://aims.fao.org/aos/agrovoc/c_15619'},
{'name': 'Sand_50cm',
'type': 'number',
'description': ' Fraction of sand in 10 '
'cm depth ',
'unit': '%',
'concept': ''},
{'name': 'Silt_50cm',
'type': 'number',
'description': ' Fraction of silt in 30 '
'cm depth ',
'unit': '%',
'concept': ''},
{'name': 'Clay_50cm',
'type': 'number',
'description': ' Fraction of clay in 50 '
'cm depth ',
'unit': '%',
'concept': 'http://aims.fao.org/aos/agrovoc/c_15619'},
{'name': 'Bulk_density_10cm',
'type': 'string',
'description': ' Bulk density in 10 cm '
'depth ',
'unit': 'g/cm3',
'concept': 'http://aims.fao.org/aos/agrovoc/c_7167'},
{'name': 'Bulk_density_30cm',
'type': 'string',
'description': ' Bulk density in 30 cm '
'depth ',
'unit': 'g/cm3',
'concept': 'http://aims.fao.org/aos/agrovoc/c_7167'},
{'name': 'Bulk_density_50cm',
'type': 'string',
'description': ' Bulk density in 50 cm '
'depth ',
'unit': 'g/cm3',
'concept': 'http://aims.fao.org/aos/agrovoc/c_7167'},
{'name': 'Stone_content_10cm',
'type': 'integer',
'description': ' Estimated stone '
'content from 0 to 10 cm '
'depth ',
'unit': '%',
'concept': ''},
{'name': 'Stone_content_30cm',
'type': 'integer',
'description': ' Estimated stone '
'content from 10 to 30 '
'cm depth ',
'unit': '%',
'concept': ''},
{'name': 'MP_density_2mm_10cm',
'type': 'string',
'description': ' Macropore density of '
'size 2-5 mm at 10 cm '
'depth ',
'unit': '-/m2',
'concept': 'http://aims.fao.org/aos/agrovoc/c_35318'},
{'name': 'MP_density_2mm_30cm',
'type': 'string',
'description': ' Macropore density of '
'size 2-5 mm at 30 cm '
'depth ',
'unit': '-/m2',
'concept': 'http://aims.fao.org/aos/agrovoc/c_35318'},
{'name': 'MP_density_5mm_10cm',
'type': 'string',
'description': ' Macropore density of '
'size >5 mm at 10 cm '
'depth ',
'unit': '-/m2',
'concept': 'http://aims.fao.org/aos/agrovoc/c_35318'},
{'name': 'MP_density_5mm_30cm',
'type': 'string',
'description': ' Macropore density of '
'size >5 mm at 30 cm '
'depth ',
'unit': '-/m2',
'concept': 'http://aims.fao.org/aos/agrovoc/c_35318'},
{'name': 'SOM_10cm',
'type': 'number',
'description': ' Soil organic matter at '
'10 cm depth ',
'unit': '%',
'concept': 'http://aims.fao.org/aos/agrovoc/c_389fe908'},
{'name': 'SOM_30cm',
'type': 'number',
'description': ' Soil organic matter at '
'30 cm depth ',
'unit': '%',
'concept': 'http://aims.fao.org/aos/agrovoc/c_389fe908'},
{'name': 'SOM_50cm',
'type': 'string',
'description': ' Soil organic matter at '
'50 cm depth ',
'unit': '%',
'concept': 'http://aims.fao.org/aos/agrovoc/c_389fe908'},
{'name': 'Total_porosity_10cm',
'type': 'string',
'description': ' Total porosity in 10 '
'cm depth',
'unit': 'cm3/cm3',
'concept': 'http://aims.fao.org/aos/agrovoc/c_7184'},
{'name': 'Total_porosity_30cm',
'type': 'string',
'description': ' Total porosity in 30 '
'cm depth',
'unit': 'cm3/cm3',
'concept': 'http://aims.fao.org/aos/agrovoc/c_7184'},
{'name': 'Total_porosity_50cm',
'type': 'string',
'description': ' Total porosity in 50 '
'cm depth',
'unit': 'cm3/cm3',
'concept': 'http://aims.fao.org/aos/agrovoc/c_7184'},
{'name': 'lon',
'type': 'number',
'description': 'longitude',
'concept': 'http://aims.fao.org/aos/agrovoc/c_64a2abf9'},
{'name': 'lat',
'type': 'number',
'description': 'latitude',
'concept': 'http://aims.fao.org/aos/agrovoc/c_64a2abf9'}],
'missingValues': ['', 'NA'],
'primaryKey': ['Site_number'],
'foreignKeys': []}},
{'name': '2_event_data',
'type': 'table',
'path': 'tables/2_event_data.csv',
'scheme': 'file',
'format': 'csv',
'mediatype': 'text/csv',
'encoding': 'utf-8',
'schema': {'fields': [{'name': 'Site_number',
'type': 'integer',
'description': ' ID number of '
'experiment location ',
'unit': '1to23',
'concept': ''},
{'name': 'Experiment_number',
'type': 'integer',
'description': ' ID number of '
'experiment ',
'unit': '1to6',
'concept': ''},
{'name': 'Experiment_start',
'type': 'string',
'description': ' Starting time of the '
'experiment ',
'unit': 'yyyy-mm-ddhh',
'concept': ''},
{'name': 'Experiment_end',
'type': 'string',
'description': ' Ending time of the '
'experiment ',
'unit': 'yyyy-mm-ddhh',
'concept': ''},
{'name': 'Land_use',
'type': 'string',
'description': ' Land use at the '
'experimental plot ',
'unit': 'pasturearableland',
'concept': ''},
{'name': 'Experiment_duration',
'type': 'integer',
'description': ' Duration of '
'experiment ',
'unit': 'min',
'concept': ''},
{'name': 'Return_period',
'type': 'string',
'description': ' Return period of the '
'simulated rainfall '
'event of the respective '
'duration ',
'unit': 'years',
'concept': ''},
{'name': 'Target_intensity',
'type': 'number',
'description': ' Target intensity '
'according to local '
'rainfall statistics and '
'maximum observed '
'rainfall values ',
'unit': 'mm/h',
'concept': ''},
{'name': 'Data_quality_comment',
'type': 'string',
'description': ' Comment on data '
'quality ',
'unit': '-',
'concept': ''},
{'name': 'Selected_subplots',
'type': 'string',
'description': ' Subplot selected for '
'evaluation of '
'experiment results '
'according to data '
'quality comment ',
'unit': '-',
'concept': ''},
{'name': 'P_RG_1',
'type': 'number',
'description': ' Observed rainfall '
'during experiment at '
'rainfall gauge 1 ',
'unit': 'mm',
'concept': ''},
{'name': 'P_RG_2',
'type': 'number',
'description': ' Observed rainfall '
'during experiment at '
'rainfall gauge 2 ',
'unit': 'mm',
'concept': ''},
{'name': 'P_RG_3',
'type': 'number',
'description': ' Observed rainfall '
'during experiment at '
'rainfall gauge 3 ',
'unit': 'mm',
'concept': ''},
{'name': 'P_RG_4',
'type': 'number',
'description': ' Observed rainfall '
'during experiment at '
'rainfall gauge 4 ',
'unit': 'mm',
'concept': ''},
{'name': 'P_RG_5',
'type': 'number',
'description': ' Observed rainfall '
'during experiment at '
'rainfall gauge 5 ',
'unit': 'mm',
'concept': ''},
{'name': 'P_RG_6',
'type': 'number',
'description': ' Observed rainfall '
'during experiment at '
'rainfall gauge 6 ',
'unit': 'mm',
'concept': ''},
{'name': 'P_C_1',
'type': 'number',
'description': ' Observed rainfall '
'during experiment at '
'rainfall collector 1 ',
'unit': 'mm',
'concept': ''},
{'name': 'P_C_2',
'type': 'number',
'description': ' Observed rainfall '
'during experiment at '
'rainfall collector 2 ',
'unit': 'mm',
'concept': ''},
{'name': 'P_C_3',
'type': 'number',
'description': ' Observed rainfall '
'during experiment at '
'rainfall collector 3 ',
'unit': 'mm',
'concept': ''},
{'name': 'P_C_4',
'type': 'number',
'description': ' Observed rainfall '
'during experiment at '
'rainfall collector 4 ',
'unit': 'mm',
'concept': ''},
{'name': 'P_C_5',
'type': 'number',
'description': ' Observed rainfall '
'during experiment at '
'rainfall collector 5 ',
'unit': 'mm',
'concept': ''},
{'name': 'P_C_6',
'type': 'number',
'description': ' Observed rainfall '
'during experiment at '
'rainfall collector 6 ',
'unit': 'mm',
'concept': ''},
{'name': 'P_C_7',
'type': 'number',
'description': ' Observed rainfall '
'during experiment at '
'rainfall collector 7 ',
'unit': 'mm',
'concept': ''},
{'name': 'P_C_8',
'type': 'number',
'description': ' Observed rainfall '
'during experiment at '
'rainfall collector 8 ',
'unit': 'mm',
'concept': ''},
{'name': 'P_C_9',
'type': 'number',
'description': ' Observed rainfall '
'during experiment at '
'rainfall collector 9 ',
'unit': 'mm',
'concept': ''},
{'name': 'P_C_10',
'type': 'number',
'description': ' Observed rainfall '
'during experiment at '
'rainfall collector 10 ',
'unit': 'mm',
'concept': ''},
{'name': 'P_C_11',
'type': 'number',
'description': ' Observed rainfall '
'during experiment at '
'rainfall collector 11 ',
'unit': 'mm',
'concept': ''},
{'name': 'P_subplot_A',
'type': 'number',
'description': ' Interpolated rainfall '
'for subplot A ',
'unit': 'mm',
'concept': ''},
{'name': 'P_subplot_B',
'type': 'number',
'description': ' Interpolated rainfall '
'for subplot B ',
'unit': 'mm',
'concept': ''},
{'name': 'P_subplot_C',
'type': 'number',
'description': ' Interpolated rainfall '
'for subplot C ',
'unit': 'mm',
'concept': ''},
{'name': 'P_mean_selected',
'type': 'number',
'description': ' Mean interpolated '
'rainfall for selected '
'subplots according to '
'data quality ',
'unit': 'mm',
'concept': ''},
{'name': 'Q_OF_subplot_A',
'type': 'number',
'description': ' Cumulative overland '
'flow for the experiment '
'at subplot A ',
'unit': 'mm',
'concept': ''},
{'name': 'Q_OF_subplot_B',
'type': 'number',
'description': ' Cumulative overland '
'flow for the experiment '
'at subplot B ',
'unit': 'mm',
'concept': ''},
{'name': 'Q_OF_subplot_C',
'type': 'number',
'description': ' Cumulative overland '
'flow for the experiment '
'at subplot C ',
'unit': 'mm',
'concept': ''},
{'name': 'Q_SSF_subplot_B',
'type': 'number',
'description': ' Cumulative subsurface '
'up to 40 cm depth flow '
'for the experiment at '
'subplot B ',
'unit': 'mm',
'concept': ''},
{'name': 'Q_OF_mean_selected',
'type': 'number',
'description': ' Mean cumulative '
'overland flow for '
'selected subplots '
'according to data '
'quality ',
'unit': 'mm',
'concept': ''},
{'name': 'RC_OF_subplot_A',
'type': 'number',
'description': ' Overland flow '
'coefficient for the '
'experiment at subplot '
'A ',
'unit': 'mm',
'concept': 'https://dbpedia.org/resource/Runoff_curve_number'},
{'name': 'RC_OF_subplot_B',
'type': 'number',
'description': ' Overland flow '
'coefficient for the '
'experiment at subplot '
'B ',
'unit': 'mm',
'concept': 'https://dbpedia.org/resource/Runoff_curve_number'},
{'name': 'RC_OF_subplot_C',
'type': 'number',
'description': ' Overland flow '
'coefficient for the '
'experiment at subplot '
'C ',
'unit': 'mm',
'concept': 'https://dbpedia.org/resource/Runoff_curve_number'},
{'name': 'RC_SSF_subplot_B',
'type': 'number',
'description': ' Subsurface runoff '
'coefficient for the '
'experiment at subplot '
'B ',
'unit': 'mm',
'concept': 'https://dbpedia.org/resource/Runoff_curve_number'},
{'name': 'RC_OF_mean_selected',
'type': 'number',
'description': ' Mean surface runoff '
'coefficient for '
'selected subplots '
'according to data '
'quality ',
'unit': 'mm',
'concept': 'https://dbpedia.org/resource/Runoff_curve_number'}],
'missingValues': ['', 'NA'],
'primaryKey': ['Site_number', 'Experiment_number'],
'foreignKeys': [{'fields': ['Site_number'],
'reference': {'resource': '1_site_data',
'fields': ['Site_number']}}]}},
{'name': '3_experiment_time_series',
'type': 'table',
'path': 'tables/3_experiment_time_series.csv',
'scheme': 'file',
'format': 'csv',
'mediatype': 'text/csv',
'encoding': 'utf-8',
'schema': {'fields': [{'name': 'Date_time',
'type': 'datetime',
'description': ' Date and time in '
'Central European Summer '
'Time (CEST) = UTC +2 '
'hours ',
'format': '%Y-%m-%d %H:%M',
'unit': 'yyyy-mm-ddhh',
'concept': ''},
{'name': 'Site_number',
'type': 'integer',
'description': ' ID number of '
'experiment location ',
'unit': '1to23',
'concept': ''},
{'name': 'Experiment_number',
'type': 'string',
'description': ' ID number of '
'experiment ',
'unit': '1to6',
'concept': ''},
{'name': 'Land_use',
'type': 'string',
'description': ' Land use at the '
'experimental plot ',
'unit': '-',
'concept': ''},
{'name': 'Selected_subplots',
'type': 'string',
'description': ' Subplot selected for '
'evaluation of '
'experiment results '
'according to data '
'quality comment ',
'unit': '-',
'concept': ''},
{'name': 'Experiment_duration',
'type': 'string',
'description': ' Duration of '
'experiment ',
'unit': 'min',
'concept': ''},
{'name': 'Return_period',
'type': 'string',
'description': ' Return period of the '
'simulated rainfall '
'event of the respective '
'duration ',
'unit': 'years',
'concept': ''},
{'name': 'Experiment_time_step_min',
'type': 'string',
'description': ' Consecutive time step '
'vector in minutes since '
'begin of experiment ',
'unit': '-',
'concept': ''},
{'name': 'Experiment_time_step_plus10min',
'type': 'string',
'description': ' Consecutive time step '
'vector in minutes since '
'begin of experiment + '
'10 minutes for '
'recession ',
'unit': '-',
'concept': ''},
{'name': 'Solar_radiation',
'type': 'number',
'description': ' Incoming solar '
'radiation ',
'unit': 'W/m^2',
'concept': ''},
{'name': 'Wind_direction',
'type': 'integer',
'description': ' Wind direction '
'measured in 2 m height ',
'unit': 'deg.',
'concept': ''},
{'name': 'Wind_speed',
'type': 'number',
'description': ' Wind speed measured in '
'2 m height ',
'unit': 'm/s',
'concept': ''},
{'name': 'Air_temperature',
'type': 'number',
'description': ' Air temperature ',
'unit': 'deg.C',
'concept': 'http://aims.fao.org/aos/agrovoc/c_230'},
{'name': 'Relative_humidity',
'type': 'number',
'description': ' Relative humidity ',
'unit': '%',
'concept': ''},
{'name': 'P_RG_1',
'type': 'number',
'description': ' Observed rainfall '
'during experiment at '
'rainfall gauge 1 ',
'unit': 'mm',
'concept': ''},
{'name': 'P_RG_2',
'type': 'number',
'description': ' Observed rainfall '
'during experiment at '
'rainfall gauge 2 ',
'unit': 'mm',
'concept': ''},
{'name': 'P_RG_3',
'type': 'number',
'description': ' Observed rainfall '
'during experiment at '
'rainfall gauge 3 ',
'unit': 'mm',
'concept': ''},
{'name': 'P_RG_4',
'type': 'number',
'description': ' Observed rainfall '
'during experiment at '
'rainfall gauge 4 ',
'unit': 'mm',
'concept': ''},
{'name': 'P_RG_5',
'type': 'number',
'description': ' Observed rainfall '
'during experiment at '
'rainfall gauge 5 ',
'unit': 'mm',
'concept': ''},
{'name': 'P_RG_6',
'type': 'number',
'description': ' Observed rainfall '
'during experiment at '
'rainfall gauge 6 ',
'unit': 'mm',
'concept': ''},
{'name': 'P_subplot_A',
'type': 'number',
'description': ' Interpolated rainfall '
'for subplot A ',
'unit': 'mm',
'concept': ''},
{'name': 'P_subplot_B',
'type': 'number',
'description': ' Interpolated rainfall '
'for subplot B ',
'unit': 'mm',
'concept': ''},
{'name': 'P_subplot_C',
'type': 'number',
'description': ' Interpolated rainfall '
'for subplot C ',
'unit': 'mm',
'concept': ''},
{'name': 'P_mean_selected',
'type': 'number',
'description': ' Mean interpolated '
'rainfall for selected '
'subplots according to '
'data quality ',
'unit': 'mm',
'concept': ''},
{'name': 'SM1_5cm',
'type': 'string',
'concept': ''},
{'name': 'SM1_10cm',
'type': 'string',
'concept': ''},
{'name': 'SM1_20cm',
'type': 'string',
'concept': ''},
{'name': 'SM1_30cm',
'type': 'string',
'concept': ''},
{'name': 'SM1_40cm',
'type': 'string',
'concept': ''},
{'name': 'SM2_5cm',
'type': 'string',
'concept': ''},
{'name': 'SM2_10cm',
'type': 'string',
'concept': ''},
{'name': 'SM2_20cm',
'type': 'string',
'concept': ''},
{'name': 'SM2_30cm',
'type': 'string',
'concept': ''},
{'name': 'SM2_40cm',
'type': 'string',
'concept': ''},
{'name': 'WT1_height',
'type': 'string',
'description': ' Depth of water table '
'at piezometer WT1 ',
'unit': 'cm',
'concept': ''},
{'name': 'WT2_height',
'type': 'string',
'description': ' Depth of water table '
'at piezometer WT2 ',
'unit': 'cm',
'concept': ''},
{'name': 'Q_OF_subplot_A',
'type': 'number',
'description': ' Cumulative overland '
'flow for the experiment '
'at subplot A ',
'unit': 'mm',
'concept': ''},
{'name': 'Q_OF_subplot_B',
'type': 'number',
'description': ' Cumulative overland '
'flow for the experiment '
'at subplot B ',
'unit': 'mm',
'concept': ''},
{'name': 'Q_OF_subplot_C',
'type': 'number',
'description': ' Cumulative overland '
'flow for the experiment '
'at subplot C ',
'unit': 'mm',
'concept': ''},
{'name': 'Q_SSF_subplot_B',
'type': 'number',
'description': ' Cumulative subsurface '
'up to 40 cm depth flow '
'for the experiment at '
'subplot B ',
'unit': 'mm',
'concept': ''},
{'name': 'Q_OF_mean_selected',
'type': 'number',
'description': ' Mean cumulative '
'overland flow for '
'selected subplots '
'according to data '
'quality ',
'unit': 'mm',
'concept': ''}],
'missingValues': ['', 'NA'],
'primaryKey': ['Date_time', 'Site_number'],
'foreignKeys': [{'fields': ['Site_number'],
'reference': {'resource': '1_site_data',
'fields': ['Site_number']}}]}}]}
[3]:
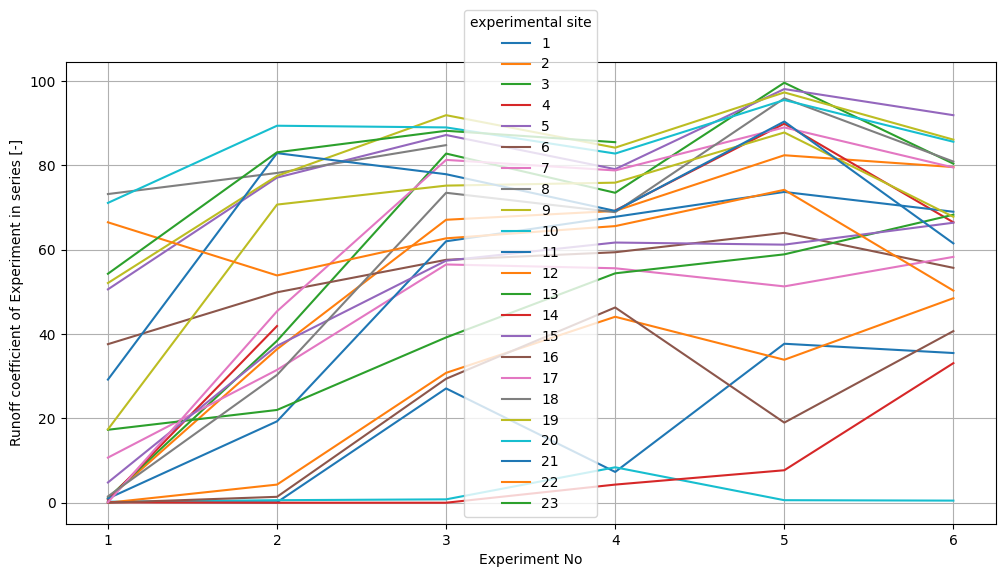
# select mean overland flow Runoff coefficients from RIES data
a = view_sp_resource(RIES.resources[1], fields = ['RC_OF_mean_selected'])
# without .open() and .close() the first call gets only the last experiments - for whatever frictionless reason
a.open()
a.close()

# convert this to pandas and draw a figure
b = a.to_pandas()

fig = plt.figure(figsize=(12, 6))
ax1 = fig.add_subplot(111)
for x in b.index.levels[0]:
    site_data = b.xs(x, level="Site_number")
    #site_data = b[b.index.get_level_values("Site_number") == x].reset_index()
    ax1.plot(site_data, label = x)
    #ax1.plot(site_data.Experiment_number, site_data.RC_OF_mean_selected, label=x)
ax1.grid()
ax1.legend(title = "experimental site")
ax1.set_ylabel("Runoff coefficient of Experiment in series [-]")
ax1.set_xlabel("Experiment No")
[3]:
Text(0.5, 0, 'Experiment No')
[4]:
a_time = view_sp_resource(RIES.resources[2],
                          fields = ['Experiment_number', 'P_mean_selected', 'Q_OF_mean_selected'],
                          #row_filters = ['P_mean_selected > 1.5']
                         )
# without .open() and .close() the first call gets only the last experiments - for whatever frictionless reason
a_time.open()
a_time.close()
a_time
[4]:
{'name': '3_experiment_time_series',
 'type': 'table',
 'data': [],
 'scheme': '',
 'format': 'inline',
 'mediatype': 'text/csv',
 'extrapaths': [],
 'schema': {'fields': [{'name': 'Date_time',
                        'type': 'datetime',
                        'description': ' Date and time in Central European '
                                       'Summer Time (CEST) = UTC +2 hours ',
                        'format': '%Y-%m-%d %H:%M',
                        'unit': 'yyyy-mm-ddhh',
                        'concept': ''},
                       {'name': 'Site_number',
                        'type': 'integer',
                        'description': ' ID number of experiment location ',
                        'unit': '1to23',
                        'concept': ''},
                       {'name': 'Experiment_number',
                        'type': 'string',
                        'description': ' ID number of experiment ',
                        'unit': '1to6',
                        'concept': ''},
                       {'name': 'P_mean_selected',
                        'type': 'number',
                        'description': ' Mean interpolated rainfall for '
                                       'selected subplots according to data '
                                       'quality ',
                        'unit': 'mm',
                        'concept': ''},
                       {'name': 'Q_OF_mean_selected',
                        'type': 'number',
                        'description': ' Mean cumulative overland flow for '
                                       'selected subplots according to data '
                                       'quality ',
                        'unit': 'mm',
                        'concept': ''}],
            'missingValues': ['', 'NA'],
            'primaryKey': ['Date_time', 'Site_number'],
            'foreignKeys': [{'fields': ['Site_number'],
                             'reference': {'resource': '1_site_data',
                                           'fields': ['Site_number']}}]}}
[6]:
b_time = a_time.to_pandas()
b_time = b_time.reorder_levels(['Site_number','Date_time']).sort_index()
b_time.head()
[6]:
| Experiment_number | P_mean_selected | Q_OF_mean_selected | ||
|---|---|---|---|---|
| Site_number | Date_time | |||
| 1 | 2016-08-16 00:01:00 | None | 0.0 | 0.0 |
| 2016-08-16 00:02:00 | None | 0.0 | 0.0 | |
| 2016-08-16 00:03:00 | None | 0.0 | 0.0 | |
| 2016-08-16 00:04:00 | None | 0.0 | 0.0 | |
| 2016-08-16 00:05:00 | None | 0.0 | 0.0 |
[7]:
fig = plt.figure(figsize=(12, 6))
ax1 = fig.add_subplot(111)
for x in b_time.index.levels[0]:
site_data = b_time.xs(x, level="Site_number")
#site_data = b[b.index.get_level_values("Site_number") == x].reset_index()
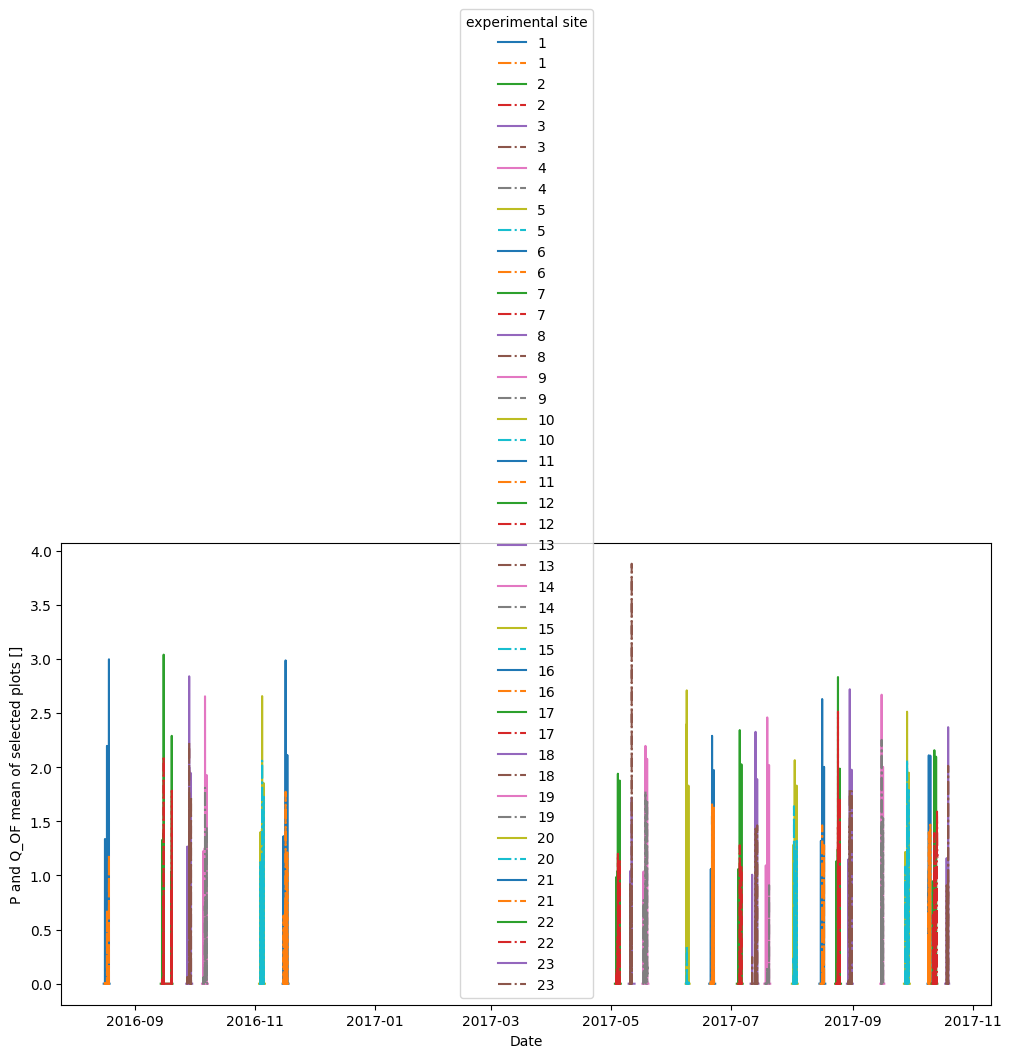
ax1.plot(site_data.index, site_data.P_mean_selected, label = x)
ax1.plot(site_data.index, site_data.Q_OF_mean_selected, label = x, linestyle = 'dashdot')
#ax1.grid()
ax1.legend(title = "experimental site")
ax1.set_ylabel("P and Q_OF mean of selected plots []")
ax1.set_xlabel("Date")
[7]:
Text(0.5, 0, 'Date')
[8]:
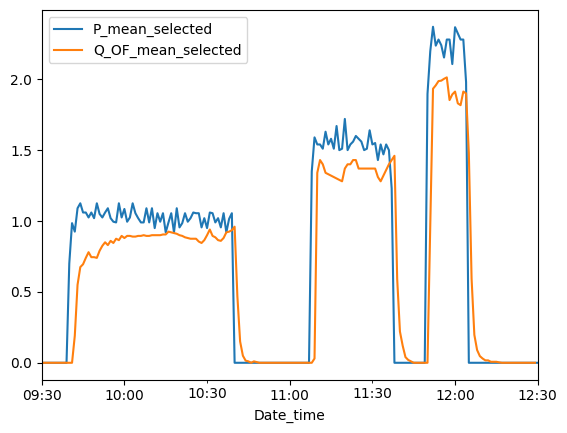
import pandas as pd
tst = pd.to_datetime('2017-10-19 09:30')
tnd = tst+pd.Timedelta(hours=3)

site_data.loc[tst:tnd].plot()
[8]:
<AxesSubplot: xlabel='Date_time'>
[9]:
agg = b_time.pivot_table(values=["P_mean_selected","Q_OF_mean_selected"], columns=['Site_number','Experiment_number'], aggfunc='sum', dropna=True)
agg = agg.T
agg['RC'] = round(agg.Q_OF_mean_selected/ agg.P_mean_selected * 100, 1)
agg
[9]:
| P_mean_selected | Q_OF_mean_selected | RC | ||
|---|---|---|---|---|
| Site_number | Experiment_number | |||
| 1 | 1 | 66.702 | 0.114 | 0.2 |
| 2 | 132.738 | 0.117 | 0.1 | |
| 3 | 118.112 | 32.044 | 27.1 | |
| 4 | 60.483 | 4.430 | 7.3 | |
| 5 | 60.251 | 22.724 | 37.7 | |
| ... | ... | ... | ... | ... |
| 23 | 2 | 61.270 | 50.930 | 83.1 |
| 3 | 45.980 | 40.550 | 88.2 | |
| 4 | 33.271 | 28.454 | 85.5 | |
| 5 | 0.000 | 0.000 | NaN | |
| 6 | 0.000 | 0.000 | NaN |
138 rows × 3 columns
[12]:
# All recalculated RC values divided by given values equal 1, so recalculation was successfull
plt.plot(agg.RC.values/b.RC_OF_mean_selected.values)
print(agg.RC.values == b.RC_OF_mean_selected.values)
print(agg.RC.values)
print(b.RC_OF_mean_selected.values)
[ True  True  True  True  True  True  True  True  True  True  True  True
  True  True  True  True  True  True  True  True False  True  True  True
  True  True  True  True  True  True  True  True  True  True  True  True
  True  True  True  True  True  True  True  True  True False False False
  True  True  True  True  True  True  True  True  True  True  True  True
  True  True  True  True  True  True  True  True  True  True  True  True
  True  True  True  True  True  True  True  True  True  True  True  True
  True  True  True  True  True  True  True  True  True  True  True  True
  True  True  True  True  True  True  True  True  True  True  True  True
  True  True  True  True  True  True  True  True  True  True  True  True
  True  True  True  True  True  True  True  True  True  True  True  True
  True  True  True  True False False]
[ 0.2  0.1 27.1  7.3 37.7 35.5  0.9 36.4 67.1 69.2 82.4 79.6  1.1 38.4
 82.8 73.5 99.6 80.4  0.7 41.9  nan 69.3 89.9 66.5 50.6 77.1 87.2 79.1
 98.1 91.9 37.6 49.9 57.6 59.4 64.  55.7 10.7 31.5 56.5 55.6 51.3 58.3
 73.2 78.2 84.8  nan  nan  nan 52.1 77.5 91.9 84.2 97.3 86.1  0.2  0.6
  0.8  8.4  0.6  0.5  1.  19.3 62.  67.8 73.7 69.   0.   4.3 30.8 44.1
 33.9 48.5 17.3 22.  39.2 54.4 58.9 68.3  0.1  0.   0.   4.3  7.7 33.1
  4.8 37.2 57.4 61.7 61.2 66.4  0.   1.4 29.4 46.3 19.  40.7  0.1 45.4
 81.3 78.8 89.  79.5  1.5 30.3 73.5 68.9 95.9 80.9 17.4 70.7 75.2 75.9
 87.8 67.8 71.1 89.4 89.  82.8 95.5 85.6 29.2 82.9 77.9 69.2 90.4 61.5
 66.5 53.9 62.7 65.6 74.2 50.3 54.3 83.1 88.2 85.5  nan  nan]
C:\Users\JL\AppData\Local\Temp\ipykernel_57876\3709138711.py:2: RuntimeWarning: invalid value encountered in divide
  plt.plot(agg.RC.values/b.RC_OF_mean_selected.values)
[ ]:
TUBAF = load_sp_datapackage({"sourcedir": "catalogue/temp_1/"})
multitable = load_sp_datapackage({"sourcedir": "catalogue/temp_2/"})
Ries = load_sp_datapackage({"sourcedir": "catalogue/temp_4/"})
view_sp_resource(TUBAF.resources[0], fields = ['SigP'], row_filters = ['SigP >9', 'SigP < 12']).to_pandas()

get_dataset_concepts(TUBAF)
get_sp_data(TUBAF, fielddefinition=[{'name': 'SigP'}])
view = merge_foreign_keys(
    get_sp_data(
        TUBAF,
        fielddefinition=[
            {'name': 'SigP',
             'row_filters': ['No == "8"']
             },
            {'unit': 'g/l',
             'row_filters': ['not sedconc == None', 'No == "8"']
             }
            ]
        )
    )

view = get_sp_data(
    TUBAF,
    fielddefinition=[
        {'name': 'SigP',
         'row_filters': ['SigP > 10']
         },
        {'unit': 'g/l',
         'row_filters': ['not sedconc == None and sedconc >=300']
         }
        ]
    )


view = merge_foreign_keys(
    get_sp_data(
        TUBAF,
        fielddefinition=[
            {'name': 'SigP',
             'row_filters': ['No == "8"']
             },
            {'unit': 'g/l',
             'row_filters': ['not sedconc == None', 'No == "8"']
             }
            ]
        )
    )

try:
    view.extract()
except:
    view.extract()

# model requirements can be defined by row constraints
#from frictionless import validate, checks, transform
#validate(TUBAF.resources[0],
#         checks=[
#             checks.row_constraint(formula="fSi + mSi + cSi == SILT"),
#             checks.row_constraint(formula="fSa + mSa + cSa == SAND"),
#             checks.row_constraint(formula="SILT + SAND + CLAY == 100")
#             ]
#         )
TUBAF.resources[1].to_pandas().head()